
Sandy MLS: Homes Sold & Housing Market, Sep 2026
Anya Bartholomew
Key Takeaway: Sandy Utah real estate, August and September 2026: 157 homes closed, down from 187 in the same two months of 2025, per the UtahRealEstate.com Market Summary Report. The median sold price was $679,900 and the average was $741,123, per the same report. Homes took a median 42 days, up from 31, per the same report. Sandy holds 4.54 months of supply (MLS Absorption Report, October 17, 2026), and the 30-year rate is 7.40% (Freddie Mac, October 15, 2026). 226 listings left the market in those two months, per the MLS listing exports pulled October 17, 2026. 69 did not sell.
Table of Contents
I pull these reports myself from the MLS Sandy Utah agents share, UtahRealEstate.com: City Sandy, County Salt Lake, residential. The city filter keeps out homes in neighboring cities that share Sandy's ZIP codes.
I run the Sales Per Month, Absorption and Market Summary reports and a full export of every home that closed or left the market without a sale, and I check each of the 157 closed sales against its first asking price.
The price a seller hears at the kitchen table is often the price that wins the listing, not the price the market will pay. The gap between those two numbers is your equity. Sell Your Home With AI reads Sandy real estate the way an analyst reads a market: MLS data plus the economic picture behind it, every number sourced and dated.
The value on a tax notice comes from the Salt Lake County Assessor. It is not a sale price. Utah is a non-disclosure state. A median is not your home.
Sandy Housing Market, September 2026: the numbers
Is now a good time to sell my house in Sandy? The Sandy housing market in September 2026, by the MLS: 82 homes sold, 38 days to sell the median home, 282 homes on the market, 4.54 months of supply. Should I sell my house now in Sandy? Fewer homes sold than a year ago. The median price rose. The price per square foot fell. This report measures the market in eight parts: what sold and what did not, mortgage rates and the payment, average and median prices, then the five fundamentals: supply, sold, pending, days on market and the list-to-sale ratio. The data is August and September 2026, set beside the same months of 2025, per UtahRealEstate.com, plus new-home permits, per the Census Bureau's Building Permits Survey through August 2026. MLS figures pulled October 17, 2026.
Sandy | Aug 2026 | Aug 2025 | Sep 2026 | Sep 2025 |
|---|---|---|---|---|
Closed sales | 74 | 95 | 82 | 92 |
Median sold price | $672,000 | $603,000 | $674,450 | $648,000 |
Average sold price | $775,702 | $741,573 | $708,227 | $797,075 |
Median original list price | $699,000 | $615,000 | $698,500 | $655,000 |
Median sold-to-original-list ratio | 96% | 98% | 97% | 99% |
Median price per square foot | $258.84 | $264.55 | $251.67 | $264.50 |
Median days on market | 43 | 24 | 38 | 38 |
1. Sandy MLS: Expired Listings vs. Homes Sold, August–September 2026
19 of 24. What to do if my house is not selling in Sandy starts with this number. 19 of the 24 Sandy listings that expired in August and September 2026 cut their price first, by a median 5.0%, and still expired, per the UtahRealEstate.com expired-listings export. They sat a median 108 days. The homes that sold took 42.
What left the market. In August and September 2026, 226 Sandy listings came off the MLS. 157 sold. 24 expired. 45 were canceled or withdrawn. A year earlier, 187 sold, 14 expired and 43 were canceled. Last year 77 of every 100 listings sold. This year, 69.
Sandy, Aug 1 to Sep 30, 2026 | Listings | Share of exits | Median price | Median days on market |
|---|---|---|---|---|
Sold | 157 | 69% | $679,900 (sold price) | 42 |
Expired | 24 | 11% | $544,500 (last list price) | 108 |
Canceled or withdrawn | 45 | 20% | $739,999 (list price) | 72 |
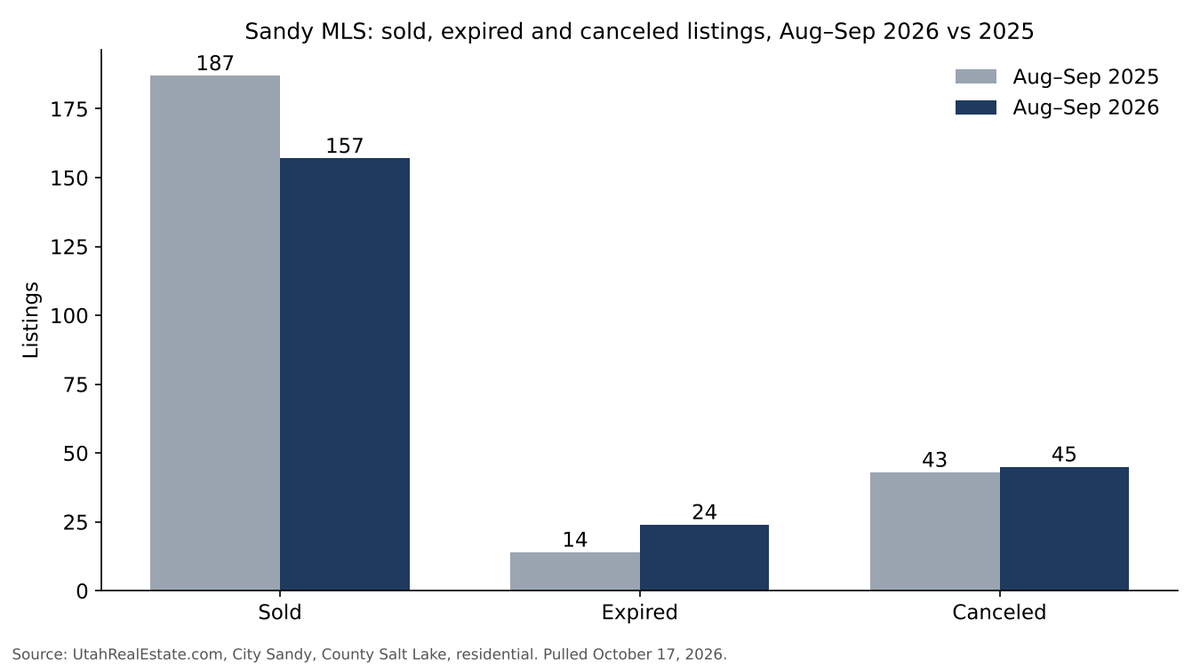
What the expired listings did on price. 19 of the 24 cut their price before they expired. Two raised it. They expired anyway.
Expired listings, price moves | 2026 | 2025 |
|---|---|---|
Cut the price, then expired anyway | 19 of 24 (79%) | 6 of 14 (43%) |
Median size of the cut | 5.0% | 10.2% |
Raised the price | 2 of 24 | 0 of 14 |
Where the listings that did not sell sat by price. The most were under $600,000. The share that sold was lowest at $1,500,000 and up.
Price band, Aug–Sep 2026 | Sold | Expired | Canceled |
|---|---|---|---|
Under $600,000 | 58 | 13 | 16 |
$600,000 to $799,999 | 58 | 3 | 12 |
$800,000 to $999,999 | 20 | 3 | 8 |
$1,000,000 to $1,499,999 | 17 | 2 | 6 |
$1,500,000 and up | 4 | 3 | 3 |
If your Sandy listing expired, this section is for you. Sandy expired listings in August and September 2026 show two facts. First, the homes that did not sell sat a long time. The median expired listing had been on the market 108 days. The median canceled listing had 72 days. The homes that sold took a median 42 days. Second, most cut their price and still expired. 19 of the 24 expired listings cut their price, by a median 5.0%. In 2025, 6 of 14 cut.
The expired count rose from 14 to 24. The median last list price of the 24 expired listings was $544,500. The median of the homes that sold was $679,900. Under $600,000, 58 homes sold and 29 did not: 13 expired and 16 were canceled. Three of the 13 expired listings in that band were manufactured homes in parks, listed under $100,000. From $600,000 to $799,999, 58 sold and 15 did not, the best sold share of any band. At $1,500,000 and up, 4 sold and 6 did not. The MLS shows the pattern. It does not show the cause for any one home.
Expired and canceled listings in Sandy, from MLS records
What happens if your house doesn't sell in Sandy? The listing ends on the date in your listing agreement, and the MLS marks it expired. The old price history stays visible to every agent.
One caution. A canceled listing is not always a failed sale. Some owners cancel and list again later. Some withdraw to rent the home. The canceled group also holds one home still under construction, listed at $7,450,000, and two new attached homes.
If your Sandy listing expired, the next price is a math problem, not a guess. The September 2026 Salt Lake County report shows sold vs. expired for the whole county. The Draper report and the Cottonwood Heights report show the same for those two cities, and the Seller's Guide shows how I set a first price.
Not an attorney, but what other sellers do: before they sign with a new agent, they read the end date and the protection-period clause in the old listing agreement, and they ask a real estate attorney if anything is unclear.
2. Mortgage Rates and the Sandy Payment
What economic factors affect selling a house in Sandy? Inflation: Salt Lake metro home prices rose 6% in dollars from the 2022 top to mid-2026 while consumer prices rose 14%, so home prices fell 7% after inflation, per FHFA and the Bureau of Labor Statistics. The cycle: yearly price growth peaked at 27% in early 2022 and stands at 2.4% in mid-2026, per the FHFA House Price Index. The full 10-year picture is in the Salt Lake County economic pillar. The third factor is the mortgage rate, and it changes every week.
$74,003. When should I sell my house in Sandy? Start with the payment. At 7.40% on October 15, 2026, per Freddie Mac, the same monthly payment carries $74,003 less house than at 6.27% a year earlier, on the Sandy median home of $679,900.
Freddie Mac 30-year rate | Aug 2026 | Aug 2025 | Sep 2026 | Sep 2025 | Oct 15, 2026 | Oct 16, 2025 |
|---|---|---|---|---|---|---|
Rate (monthly average of weekly PMMS; single week for October) | 6.67% | 6.59% | 6.86% | 6.35% | 7.40% | 6.27% |
P&I on $600,000 (20% down) | $3,088 | $3,062 | $3,148 | $2,987 | $3,323 | $2,962 |
P&I on $1,000,000 (20% down) | $5,146 | $5,104 | $5,247 | $4,978 | $5,539 | $4,936 |
P&I on $679,900 (Sandy median, 20% down) | $3,499 | $3,470 | $3,568 | $3,384 | $3,766 | $3,356 |
Income needed for $679,900 (28% rule, P&I only) | $149,956 | $148,723 | $152,902 | $145,048 | $161,400 | $143,832 |
Payment math: principal and interest only, 30-year fixed, 20% down. Income needed is the payment times 12, divided by 0.28.
The payment sets the price ceiling
The payment sets the ceiling on the price. Last October, at 6.27%, a $3,356 monthly payment carried a $679,900 Sandy home. Today, at 7.40%, the same payment carries about $605,897. That is $74,003 less house for the same money.
Income needed for the Sandy median
Income tells the same story. To carry $679,900, a household needed about $143,832 a year last October. Now it needs about $161,400. The Sandy median household income is $112,176, per Census QuickFacts (American Community Survey 2020–2024, in 2024 dollars).
Mortgage rate forecast for 2026 and 2027
Relief is not in the forecast. The Fannie Mae Housing Forecast of October 12, 2026 puts the rate at 7.4% for the rest of 2026 and 7.5% for 2027. The Mortgage Bankers Association reported on October 14, 2026 that purchase applications fell 4% in a week. The 2027 forecast post sets three forecasts side by side.
Not a lender, but what other sellers do: they ask the lender on the other side for a written payment at two prices before they agree to a price cut, so they can see whether a cut or a rate buydown moves the payment more. The sell now or wait math runs the same comparison for the whole county.
3. Average and Median Sold Prices in Sandy
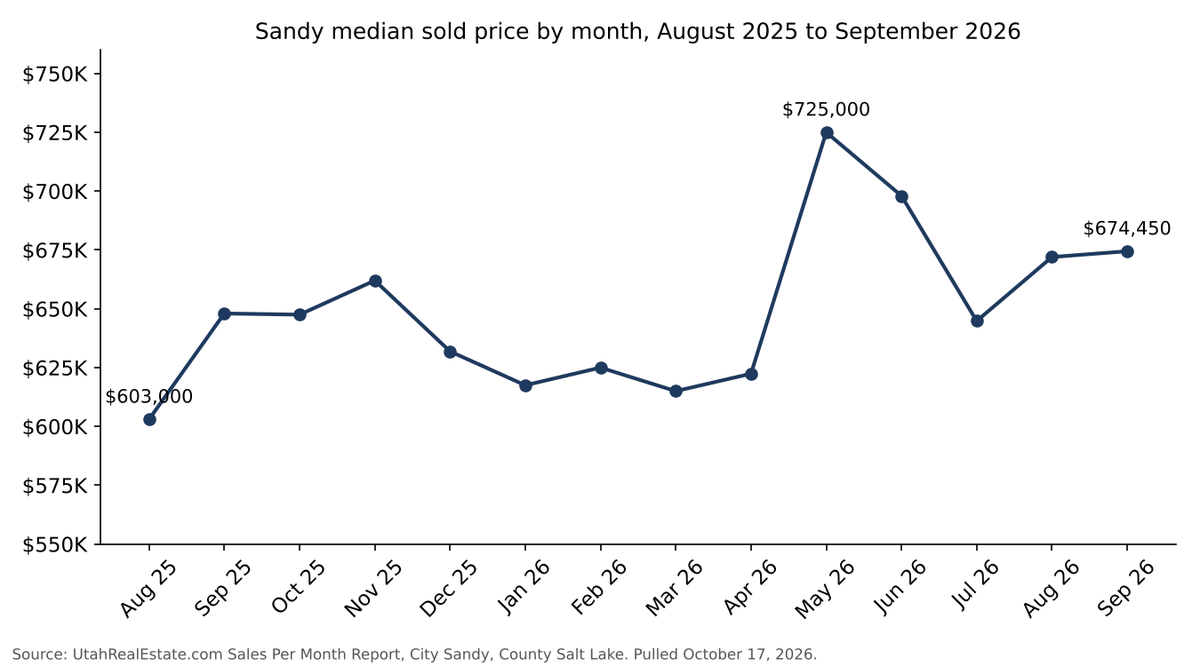
$679,900. Sandy home prices, by the MLS: the median sold price for August and September 2026 was $679,900, up 10.6% from $615,000 in the same two months of 2025, per the UtahRealEstate.com Market Summary Report.
What is the average home price in Sandy Utah? $741,123 for August and September 2026, down 3.6% from $768,878 a year earlier, per the same report. The median rose and the average fell.
Sandy | Aug 2026 | Aug 2025 | Sep 2026 | Sep 2025 |
|---|---|---|---|---|
Median sold price | $672,000 | $603,000 | $674,450 | $648,000 |
Average sold price | $775,702 | $741,573 | $708,227 | $797,075 |
Median price per square foot | $258.84 | $264.55 | $251.67 | $264.50 |
Sandy home worth: median, price per square foot, assessor value
How much is my house worth in Sandy starts with two MLS numbers. The median sold price was $679,900 for August and September 2026, up 10.6% from a year earlier. The median price per square foot was $253, down 4.2% from $264, per the sold-listings export.
A median is the market, not your home.
Bigger homes, lower price per square foot
Both facts are true at once. Sandy house prices rose at the median: 11.4% in August and 4.1% in September against the same months of 2025. The homes that sold were also bigger: the median size was about 2,522 square feet, against about 2,422. Bigger homes sold for less per square foot. Fewer sales under $600,000 also pushed the median up: 58 this year against 87. The mix of homes changed, so neither number alone proves that Sandy home values rose or fell.
Tax value and Census value vs. sale price
What is my house worth in Sandy against that median? Price per square foot is the closer guide for one home. The value on a tax notice is a different number: the Salt Lake County Assessor sets it for taxes. The Census figure, $614,100 for 2020–2024 (American Community Survey), is what owners told a survey. Neither is a sale price.
Not a tax advisor, but what other sellers do: they check their Salt Lake County primary residential exemption and their capital gains exclusion with a CPA before they list, so the net number they plan around is real.
Home price indexes: Salt Lake metro and national
Sandy home prices against the region: the FHFA House Price Index for the Salt Lake City metro rose 2.4% in the year to the second quarter of 2026, and the S&P Cotality Case-Shiller national index rose 1.9% in the year to July 2026, per FRED. Two months of city sales and a quarterly index are not the same measure. The average, $741,123, sits above the median because of the top sales. For the same two months, the median sold price was $855,000 in Draper and $746,000 in Cottonwood Heights, per the UtahRealEstate.com Market Summary Report.
4. Active Listings and Months of Supply in Sandy
4.54 months. Sandy holds 4.54 months of supply. It would take 4.54 months to sell every Sandy home now listed, under contract or taking backup offers, at the pace of the last two months, per the UtahRealEstate.com Absorption Report of October 17, 2026.
Window ending October 17, 2026 | Active | Backup | Under contract | Sold in window | Sold per month | Months of supply |
|---|---|---|---|---|---|---|
2 months | 282 | 22 | 39 | 151 | 75.50 | 4.54 |
6 months | 282 | 22 | 39 | 525 | 87.50 | 3.92 |
12 months | 282 | 22 | 39 | 937 | 78.08 | 4.39 |
Is it a sellers market in Sandy? Read the supply: 4.54 months in Sandy, against 4.97 months for Salt Lake County. On October 17, 2026, 282 Sandy homes were active on the market, 22 more were taking backup offers and 39 were under contract, per the UtahRealEstate.com Absorption Report. Over the two months ending that day, 151 homes sold, or 75.50 a month. The MLS method adds all three groups, 343 homes, and divides by that monthly pace. The answer is 4.54 months. If you count only the 282 active listings, the same report gives 3.74 months.
Sandy inventory: what the active listings mean
When your house won't sell in Sandy, look at the inventory. This table is the first thing to check. It does not say why one home failed. It says how many homes are seen before yours.
Why the MLS windows differ
The windows end October 17, not September 30. That is why the two-month window shows 151 sales while August and September show 157. Every window from two to twelve months lands between 3.92 and 4.54 months. The two-month window is the slowest.
Price cuts on active listings
Price cuts are already common. 168 of the 282 active listings, 60%, were priced below their first asking price on October 17, 2026, per an MLS report on all active listings.
Salt Lake County active listings
The county tells the same story: 3,529 active listings in Salt Lake County in September 2026, up 17.2% from 3,011 a year earlier, per FRED series ACTLISCOU49035, and 4.97 months of supply on October 14, 2026, per my September county report. Sandy is a little faster than the county. Draper held 5.32 months of supply and Cottonwood Heights held 5.50, per the UtahRealEstate.com Absorption Report pulled October 16, 2026.
Supply by price band
List-price band, October 17, 2026 | Active | With a price cut | Sold, Aug–Sep 2026 | Months of active supply |
|---|---|---|---|---|
Under $600,000 | 108 | 60 | 58 | 3.7 |
$600,000 to $799,999 | 79 | 55 | 58 | 2.7 |
$800,000 to $999,999 | 27 | 17 | 20 | 2.7 |
$1,000,000 to $1,499,999 | 32 | 19 | 17 | 3.8 |
$1,500,000 and up | 36 | 17 | 4 | 18.0 |
The band math uses active listings only, divided by the August–September sold pace, per the UtahRealEstate.com active-listings report and the sold-listings export. From $600,000 to $999,999, Sandy has under three months of active homes. At $1,500,000 and up, it has 18 months.
How to sell a house that won't sell in Sandy starts with the 282 active listings and the 4.54 months of supply: your price competes with every one in your band. Yours is not the only home on the tour this week. It is one of 282. Price and condition decide which of the 282 gets the showing.
5. Closed Sales in Sandy, August–September 2026
157. Closed sales in Sandy, Utah, August and September 2026: 157, down 16% from 187 in the same two months of 2025, per the UtahRealEstate.com Market Summary Report.
Sandy closed sales | Aug 2026 | Aug 2025 | Sep 2026 | Sep 2025 | Aug–Sep 2026 | Aug–Sep 2025 |
|---|---|---|---|---|---|---|
Closed sales | 74 | 95 | 82 | 92 | 157 | 187 |
How many homes sold in Sandy? 157 in two months, against 187 a year earlier. Demand fell by a sixth: real estate in Sandy closed 30 fewer sales than a year earlier. The month counts come from the Sales Per Month Report and add to 156; the two-month totals come from the Market Summary Report, which counts one more sale. 150 of the 157 sales were resales, and the median home was built in 1981, per the UtahRealEstate.com sold-listings export pulled October 17, 2026. Most sales sat in two price bands. 58 homes sold under $600,000 and 58 sold from $600,000 to $799,999. 20 sold from $800,000 to $999,999, 17 from $1,000,000 to $1,499,999 and 4 at $1,500,000 and up. Homes from $800,000 to $999,999 took a median 30 days. Homes at $1,500,000 and up took 141.5.
6. Pending Sales in Sandy
61. Are houses selling right now in Sandy? Yes. On October 17, 2026, Sandy had 61 pending home sales, 39 under contract and 22 taking backup offers, against 282 active listings, per the UtahRealEstate.com Absorption Report: about one in five.
Snapshot on October 17, 2026 | Sandy |
|---|---|
Under contract | 39 |
Accepting backup offers | 22 |
Pending home sales, total | 61 |
Active listings | 282 |
Pending as a share of active | 22% |
Pending sales show next month's closings before they print. By list price, 29 of the 61 pending sales were under $600,000 and 12 were from $600,000 to $799,999, against 79 active homes in that band, per the MLS report on active, backup and under-contract listings. The full-price window is short; section 7 shows the 60-day line.
The next 60 days of a Sandy listing
Best time to sell a house in Sandy? Measured by seller power, it was 2021 to mid-2022. Measured by what you can control, it is the first 60 days of the next listing. The 10-year cycle does not say prices will fall. It says which market you are pricing into: more homes on the market, slower sales, a higher payment and prices that rise slowly. In August and September 2026, homes that went under contract within 60 days kept a median 98.9% of their first asking price; slower sales kept 93.0%, per the UtahRealEstate.com sold-listings export.
Not a financial advisor, but what other sellers do: before they decide to wait, they add up 12 more months of payments, taxes, insurance and upkeep, and set that against what prices did over the last 12 months.
7. Days on Market in Sandy
42 days. That is how long it takes to sell a house in Sandy: the median across all 157 sales in August and September 2026, up from 31 days a year earlier, per the UtahRealEstate.com Market Summary Report.
Sandy | Aug 2026 | Aug 2025 | Sep 2026 | Sep 2025 |
|---|---|---|---|---|
Median days on market | 43 | 24 | 38 | 38 |
Average days on market | 52 | 35 | 58 | 49 |
By price band. The median hides a wide spread. The middle bands moved fastest.
Sold-price band, Aug–Sep 2026 | Homes sold | Median DOM |
|---|---|---|
Under $600,000 | 58 | 42 |
$600,000 to $799,999 | 58 | 38 |
$800,000 to $999,999 | 20 | 30 |
$1,000,000 to $1,499,999 | 17 | 53 |
$1,500,000 and up | 4 | 141.5 |
August vs. September days on market
How long does it take to sell a house in Sandy? 42 days at the median. August was the slow month: 43 days, against 24 a year earlier. The listing dates show why. 42 of the 74 August sales were first listed in April, May or June 2026, and they took a median 61.5 days; the other August sales took 19, per the sold-listings export. In August 2025, spring listings took a median 42 days, per the sold-listings export.
The 60-day line: price kept before and after day 60
House not selling in Sandy? After 60 days it has crossed the line the data draws. Homes that went under contract within 60 days closed at a median 98.9% of their first asking price. Homes that took longer closed at 93.0%, per the August–September 2026 sold-listings export. That is 5.9 points, or $59,000 on a $1,000,000 first price. 62 of the 157 sales took more than 60 days. Home not selling at day 30? From $800,000 to $999,999, that is the median (30 days). My house is not selling at day 90? Under $1,500,000, that is late in every band.
Sandy's 42 days compares with 62 days in Draper and 40 in Cottonwood Heights for August and September 2026, per the UtahRealEstate.com Market Summary Report.
Days on market is one of the first things the other side's agent checks, and one of the things I tell sellers never to dismiss in a first meeting.
8. List-to-Sale Price Ratio in Sandy
97%. When to lower the price on a house in Sandy? Before day 60. In September 2026 the median Sandy sold price was 97% of the median original asking price, per the UtahRealEstate.com Sales Per Month Report. Homes that went under contract within 60 days kept a median 98.9%, per the sold-listings export.
Sandy | Aug 2026 | Aug 2025 | Sep 2026 | Sep 2025 |
|---|---|---|---|---|
Median sold-to-original-list ratio (MLS) | 96% | 98% | 97% | 99% |
Average sold-to-original-list ratio (MLS) | 95% | 95% | 93% | 94% |
Median of each sale's own ratio (export) | 97.0% | 97.7% | 96.5% | 96.4% |
Under, at and above the first price. More sellers missed their first price this year. The ones who missed gave up the same 5.1%.
Sandy sales vs original list price | Aug–Sep 2026 | Aug–Sep 2025 |
|---|---|---|
Sold under original list | 116 of 157 (74%) | 130 of 187 (70%) |
Sold at original list | 20 (13%) | 30 (16%) |
Sold above original list | 21 (13%) | 27 (14%) |
Median discount from original list, when sold under | 5.1% | 5.1% |
Sales with a seller concession | 92 of 157 (59%) | 110 of 187 (59%) |
Median concession, when one was paid | $10,000 | $10,000 |
Two ways to read the ratio
Two ratios appear above. The MLS figure compares the month's median sold price with its median original asking price. The export figure is the middle sale's own ratio, 97.0% in August and 96.5% in September. Use the export figure for one home.
Price reductions and concessions in Sandy
House not selling after a price reduction in Sandy? The homes that sold under their first price cut a median 5.1%, or $35,700 on a $700,000 first price, per the UtahRealEstate.com sold-listings export. What matters is when the cut comes and what the home looks like next to the 282 active listings. What can I do if my house won't sell in Sandy? Reset the comparison, not just the number: new photos, a dated price, and the payment math at 7.40%, then relist against the current competition. Relaunch, not relist.
Seller concessions in Sandy
Concessions are on top of the price cut. 92 of the 157 sales carried a seller concession, 59%, with a median of $10,000 when one was paid, the same share and median as in 2025. In 42 of the 92, the concession was bigger than the price cut. Utah is a non-disclosure state, so the recorded price does not show it. The MLS does. That is why I walk a seller through a net sheet before any price talk, and the Seller's Guide shows how I set the first price from the export, not from an online estimate.
Not a CPA, but what other sellers do: they ask their tax preparer how a concession changes the amount realized on the sale before they agree to one, because a concession and a price cut are not always the same on paper.
9. New Construction in Sandy: Permits and New Listings
19 permits. Sandy issued 19 single-family building permits from January to August 2026, against 10 in the same months of 2025, per the U.S. Census Bureau Building Permits Survey (read October 17, 2026).
Sandy city, building permits | 2024 | 2025 | Jan–Aug 2025 | Jan–Aug 2026 |
|---|---|---|---|---|
Single-family units | 17 | 25 | 10 | 19 |
Units in buildings with 2 or more units | 8 | 0 | 3 | 0 |
Total units | 25 | 25 | 13 | 19 |
Construction value per single-family unit | $447,625 | $583,166 | $526,903 | $566,032 |
Permit values in Sandy
Builders are a small part of the Sandy market. The Census Bureau's Building Permits Survey counts 19 single-family permits from January to August 2026, per the year-to-date file read October 17, 2026. Sandy reported 6 of those 8 months; Census estimates the rest. The estimated construction value per permit was $566,032, before land. A permit is months away from a home on the market.
Sandy, new vs. resale | Sold, Aug–Sep 2026 | Active, October 17, 2026 |
|---|---|---|
New construction | 7 | 32 |
Resale | 150 | 250 |
New attached homes from $499,000
The MLS shows where the new homes compete. 7 of the 157 sales in August and September 2026 were new homes, at a median $609,900, and 5 of them were attached homes in one project, per the sold-listings export. On October 17, 2026, 32 of the 282 active listings were new construction, per the MLS report on active listings: 14 attached homes from $499,000 to $609,900, and 18 single-family homes from $749,900 to $8,900,000. For an attached home or a home under $750,000, a builder may be on the same tour.
Builder incentives vs. resale in Sandy
Builders sell the payment, not the price: a builder pays for a rate buydown from its margin, a resale seller pays from equity. If your home is in the new-home price range, list it the way I list against builders.
Not a lender, but what other sellers do: before they offer a rate buydown to compete with a builder, they ask a lender to price the buydown in dollars and compare it with the same dollars taken off the price.
10. Sandy Home Values by Neighborhood
Neighborhood, Aug–Sep (MLS subdivision names) | 2026 sales | 2026 median sold | 2026 median DOM | 2025 sales | 2025 median sold | 2025 median DOM |
|---|---|---|---|---|---|---|
White City (all plats) | 6 | $520,000 | 19 | 14 | $513,172 | 20.5 |
Meadows On Cy's Road | 5 | $609,900 | 24 | 0 | no sales | no sales |
Park | 5 | $595,000 | 85 | 6 | $650,000 | 28.5 |
Tate | 5 | $680,000 | 70 | 1 | one sale | one sale |
Eastridge (all plats) | 5 | $662,900 | 38 | 7 | $587,800 | 29 |
Willow Creek (all names) | 4 | $1,048,375 | 62 | 7 | $1,197,198 | 6 |
Bell Canyon (all names) | 4 | $609,500 | 58 | 2 | $1,399,400 | 68.5 |
Dimple Dell (all names) | 3 | $950,000 | 68 | 2 | $835,000 | 32 |
Meadows | 3 | $770,000 | 76 | 4 | $740,500 | 8 |
Quail Hollow (all plats) | 3 | $650,000 | 38 | 1 | one sale | one sale |
Pepperwood, the Bluff at Hidden Valley, Hidden Valley Country Club and the Ridge at Little Cottonwood had one sale each in 2026. One sale is one home, so this report does not print its price. A year earlier, Pepperwood had 8 sales.
White City, the busiest neighborhood
White City was the busiest named area again: six sales at a median $520,000, against $513,172 a year earlier, still selling in about 19 days. The sales count fell from 14 to 6. Small neighborhood counts swing, which is why I price a Sandy home from the closest five or six sales. Neighborhood figures come from the UtahRealEstate.com sold-listings export pulled October 17, 2026.
Slower sales in Park, Tate and Willow Creek
The named areas with a long median time on the market were Park (85 days), Tate (70) and Willow Creek (62). In 2025, Park sold in a median 28.5 days and Willow Creek in 6. Tate had one sale. Willow Creek and Bell Canyon group several MLS subdivision names, so their medians mix different homes.
11. Frequently asked questions
What is the average home price in Sandy Utah?
$741,123 for August and September 2026, per the UtahRealEstate.com Market Summary Report, down 3.6% from $768,878 a year earlier. The median, $679,900, is the better guide to real estate in Sandy, because two sales above $2,000,000 lift the average.
Are Sandy home values going down?
The median, no. The price per square foot, yes. The median sold price rose 10.6%, from $615,000 to $679,900, per the UtahRealEstate.com Market Summary Report (August–September 2026, pulled October 17, 2026). The median price per square foot fell 4.2%, from $264 to $253, per the sold-listings export, and the homes that sold were bigger. The Salt Lake metro FHFA index rose 2.4% in a year and is 7% below its 2022 top after inflation. What clearly fell is the number of sales, down 16%.
Is my house sitting on the market too long in Sandy?
Past 60 days, yes by the data. Sandy homes that went under contract within 60 days closed at a median 98.9% of their first asking price. Homes that took longer closed at 93.0%, per the August–September 2026 sold-listings export from the Sandy MLS.
Should I sell my house now or wait until 2027 in Sandy?
The Fannie Mae Housing Forecast of October 12, 2026 puts the 30-year rate at 7.4% for the fourth quarter of 2026 and 7.5% for 2027. At 7.40%, the same payment buys $74,003 less on a $679,900 Sandy home than it did a year ago. The sell now or wait math runs the payment for the whole county. The 2027 forecast post sets three forecasts side by side.
Is Sandy, Utah affluent?
By income, yes, compared with the county. The median household income was $112,176 for 2020–2024 in 2024 dollars, against $97,494 in Salt Lake County, and 75.2% of occupied homes are lived in by their owners, per Census QuickFacts. Income is not wealth.
12. Sandy Housing Market, September 2026: the data against the talk
The Sandy housing market, August–September 2026: here is what the MLS says against what you will hear. Should I sell my house now or wait in Sandy? Read the right column.
What you will hear | What the August–September 2026 data says | Why it matters |
|---|---|---|
"Sandy prices are up, so the market is fine." | The median rose 10.6%; the number of sales fell 16%. | A higher median on fewer sales is a mix change, not a hot market. |
"List high. You can always come down." | 74% of sales closed under the first price, a median 5.1% below it. | The market pays for the right price, not the first price. |
"Homes sell in a few weeks." | The median was 42 days across 157 sales, up from 31. | Past 60 days, sales closed at a median 93.0% of the first price, against 98.9% for faster sales. |
"Sandy is a tight market." | 4.54 months of supply on October 17, 2026; 168 of the 282 active listings had a price cut. | Your home has to win the comparison. |
"Luxury homes always sell." | At $1,500,000 and up: 4 sold, 36 active, 18 months of active supply. | The top band is the slowest in Sandy. |
"Rates don't matter here." | At 7.40%, the same payment carries $74,003 less on a $679,900 home than a year ago. | The payment is the ceiling on the price. |
If my house isn't selling in Sandy, the data above is the first meeting. Bring the old listing sheet. Every outside link on this page goes to the organization that published the number, and every number has a date. The decision is yours. When your next step is to sell, start with the 28-Day Eligibility Check: sell your home in 28 days or get a cash offer. Terms apply.
Anya Bartholomew, MBA, REALTOR®, Equity Real Estate Premier Elite, Utah license 5810503-SA00. Figures pulled October 17, 2026. Questions? Need comps? Call or text 801-654-5214. No obligation.
Other primary sources: the September 2026 Salt Lake County report, the Kem C. Gardner Policy Institute, and the UtahRealEstate.com statistics pages.
Free download: the Seller's Guide.
Notes on the data. Based on information from UtahRealEstate.com for the period August 1, 2025 through October 17, 2026. All MLS figures come from the Sandy MLS records on UtahRealEstate.com, City Sandy, County Salt Lake, residential. The Market Summary Report counts 157 sales for August–September 2026 and 187 for 2025; the Sales Per Month Report counts 156 and 187. The two-month median and average come from one Market Summary run. The Absorption Report is a snapshot on October 17, 2026. The sold-listings and expired-listings exports are the source for under-list shares, concessions, new vs. resale, band medians, neighborhoods and the expired counts. No single home's sold price is printed. Rates are Freddie Mac's weekly survey, averaged by month; payment math is principal and interest, 30-year fixed, 20% down. Utah is a non-disclosure state: recorded prices do not show concessions. Information is deemed reliable but not guaranteed. A median is not your home.