
Draper Home Prices, Adjusted for Inflation: October 2026
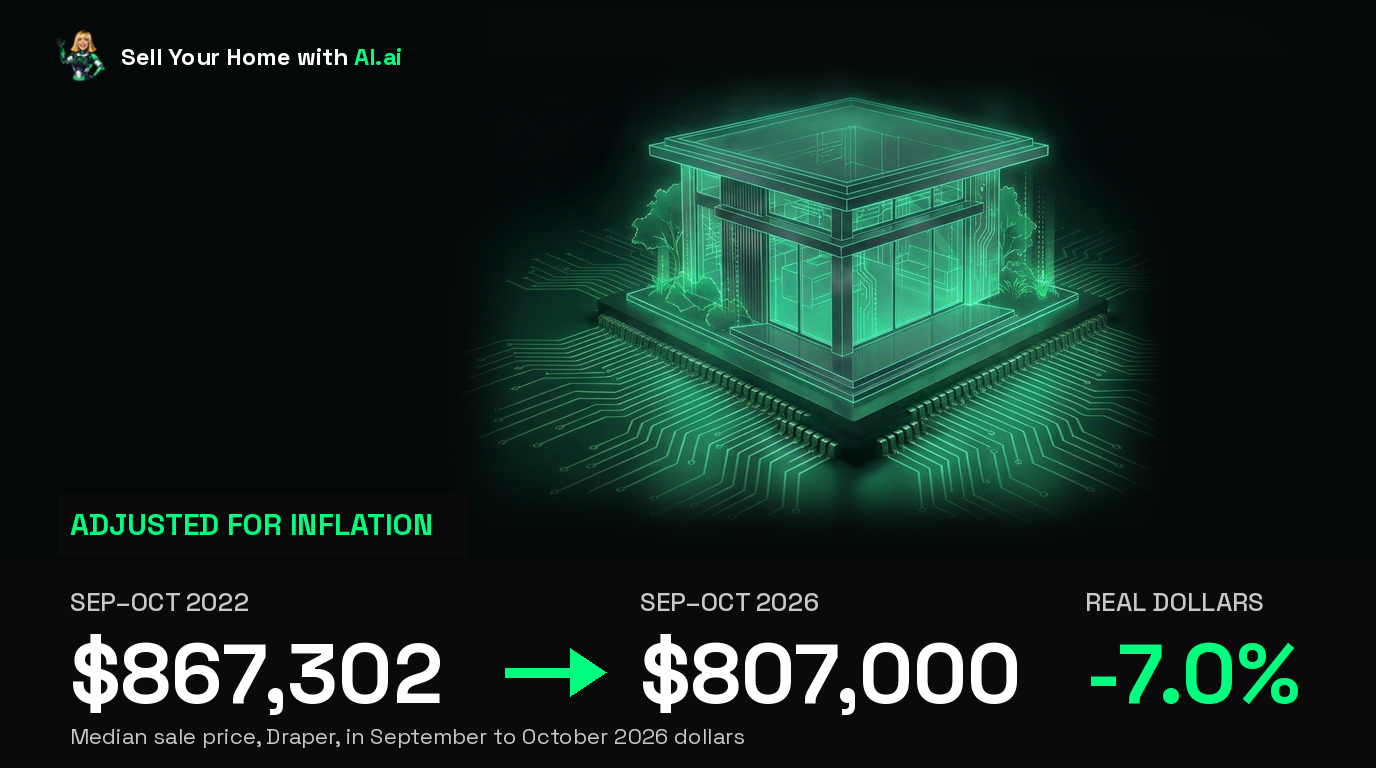
The Draper real estate market in real dollars. The median price was $807,000 from September to October 2026, on 67 sales. Adjusted for inflation, that is 7.0% below September to October 2022.
Where Do These Numbers Come From?
My Draper numbers come from UtahRealEstate.com, using MLS sales and listing records for homes in Draper. Homes for sale and months of inventory come from the UtahRealEstate.com Monthly Metrics report. The analysis covers January 2020 through October 2026. Mortgage rates come from Freddie Mac. Inflation figures come from the Bureau of Labor Statistics Consumer Price Index. Every chart identifies its source and reporting period.
Based on information from UtahRealEstate.com for the period January 1, 2020 through November 13, 2026. UtahRealEstate.com does not guarantee and is not responsible for the accuracy of the analysis and calculations in this report.
Median Sale Price
Draper home prices higher or lower than in 2022?
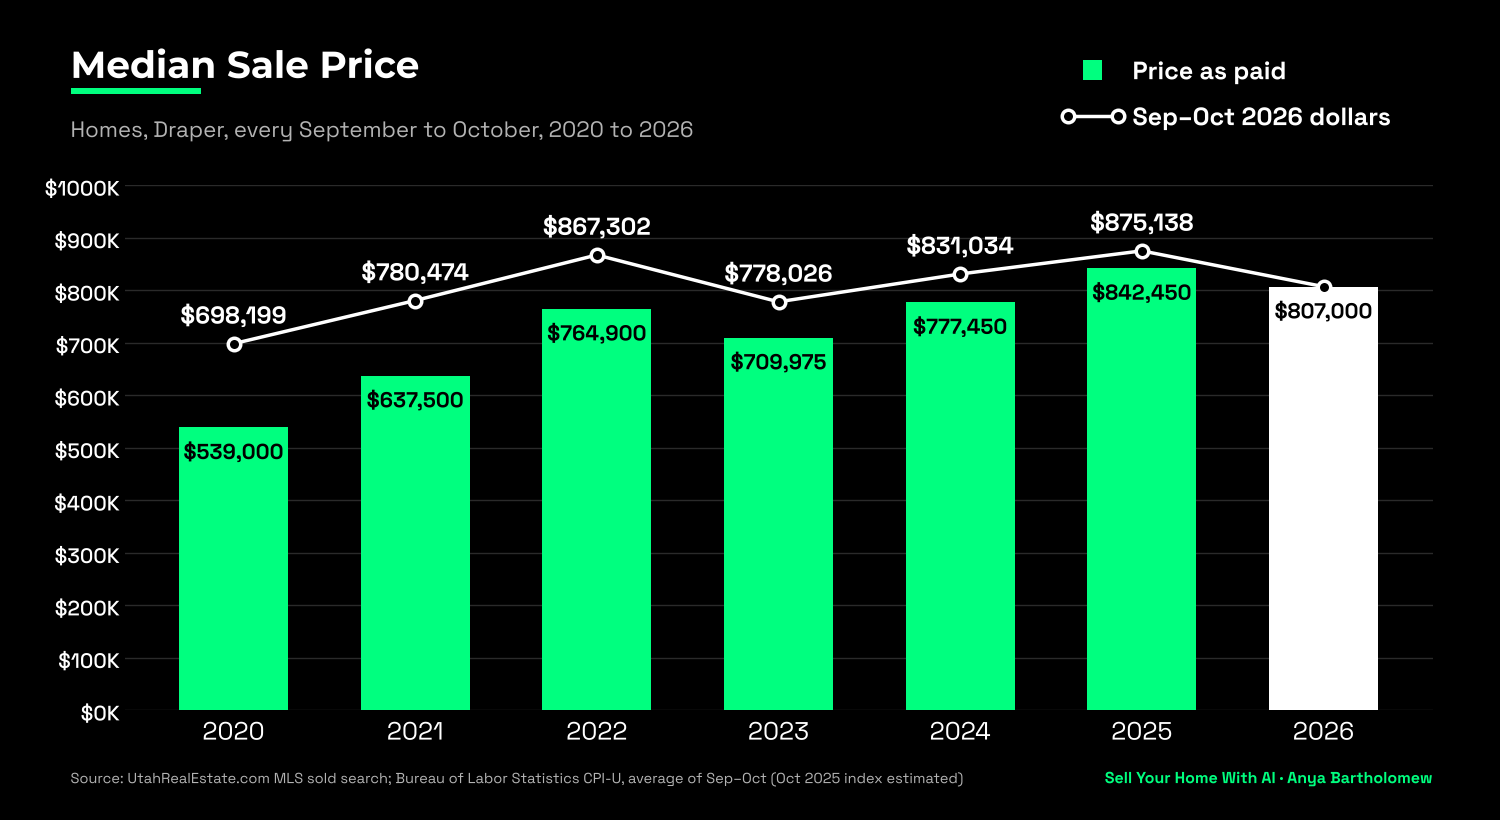
From September to October 2022, the median sold price in Draper was $764,900, on 63 sales.
From September to October 2026, it was $807,000, on 67 sales.
That looks like a gain of $42,100.
But consumer prices rose 13.4% in those four years, per the Bureau of Labor Statistics.
So $764,900 then equals $867,302 today.
In real dollars, the median is down $60,302, or 7.0%.
Draper home prices higher or lower than in 2020?
From September to October 2020, the median sold price in Draper was $539,000, on 172 sales.
From September to October 2026, it was $807,000, on 67 sales.
That looks like a gain of $268,000.
But consumer prices rose 29.5% in those six years, per the Bureau of Labor Statistics.
So $539,000 then equals $698,199 today.
The real gain is $108,801, or 15.6%.
The rest is inflation.
Median Sale Price
The text above uses September to October together. The table shows each month alone.
Month | 2020 | 2021 | 2022 | 2023 | 2024 | 2025 | 2026 |
|---|---|---|---|---|---|---|---|
Jan | $488,204 | $527,041 | $865,750 | $720,000 | $809,000 | $845,000 | $874,700 |
Feb | $533,750 | $634,434 | $685,000 | $617,750 | $690,000 | $675,100 | $925,000 |
Mar | $503,250 | $645,000 | $797,312 | $675,000 | $697,397 | $885,000 | $975,000 |
Apr | $525,178 | $641,000 | $718,000 | $627,500 | $672,500 | $1,004,000 | $853,000 |
May | $565,000 | $610,000 | $795,000 | $799,950 | $880,000 | $920,000 | $760,000 |
Jun | $489,000 | $693,250 | $820,000 | $811,700 | $834,950 | $850,000 | $702,500 |
Jul | $512,000 | $802,495 | $697,500 | $820,000 | $788,000 | $875,250 | $775,000 |
Aug | $599,250 | $630,000 | $824,250 | $719,500 | $740,890 | $697,500 | $840,000 |
Sep | $579,000 | $620,000 | $764,900 | $692,000 | $723,500 | $842,450 | $885,000 |
Oct | $512,926 | $642,750 | $772,500 | $709,975 | $812,500 | $837,500 | $669,840 |
Nov | $539,000 | $643,000 | $744,275 | $890,000 | $825,000 | $828,000 | |
Dec | $599,500 | $762,354 | $644,500 | $750,000 | $949,000 | $773,265 |
Nationally, Case-Shiller rose 2.1% in the year to August 2026, while inflation ran 3.4%.
Source: UtahRealEstate.com MLS sold search (Draper, Residential, September to October, 2020–2026) and Sales Per Month Report (Jan 2020–Oct 2026).
Average Sale Price
Draper average home price higher or lower than in 2022?
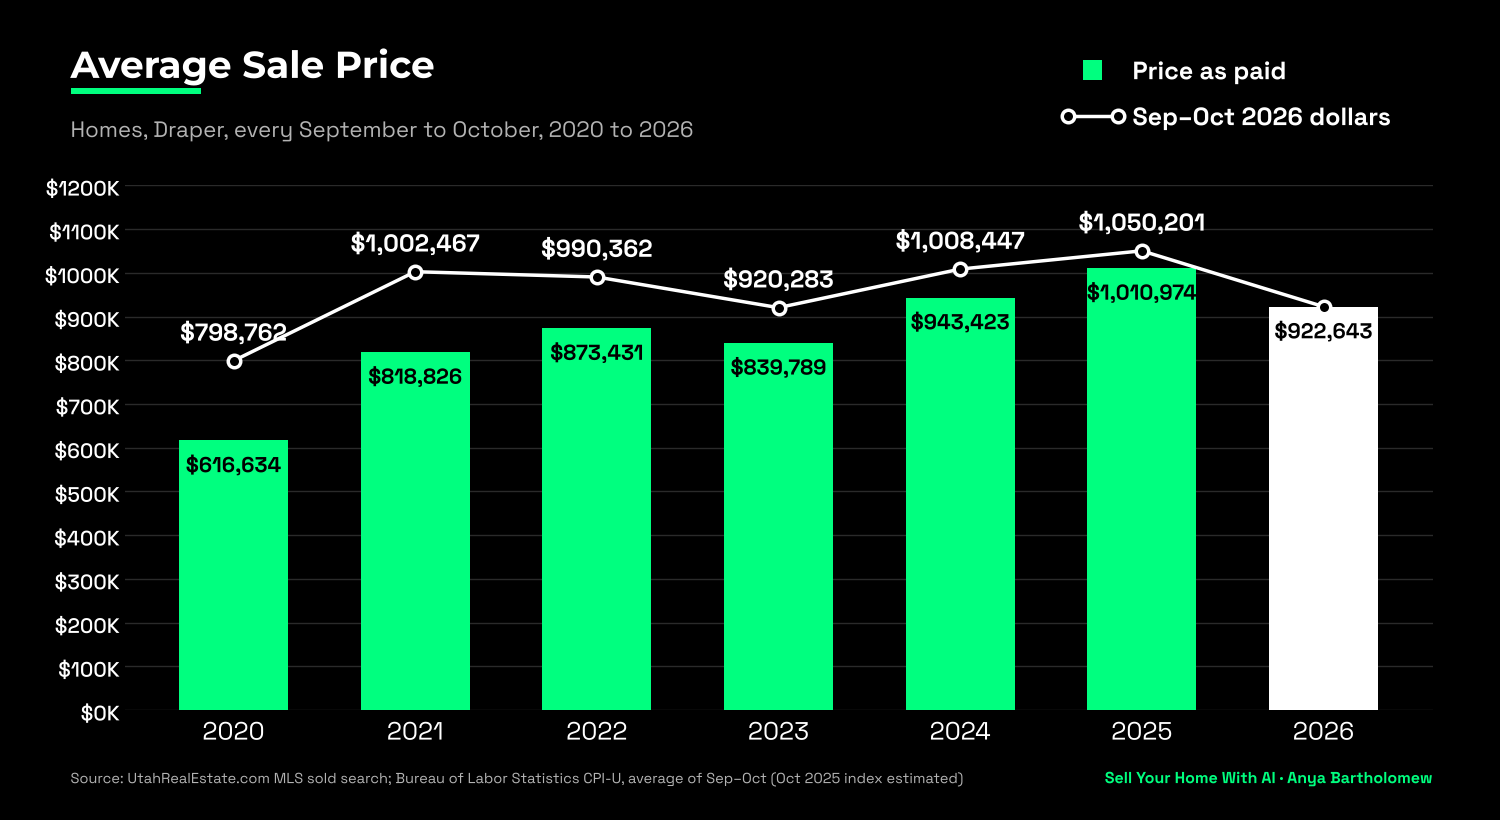
From September to October 2022, the average sold price in Draper was $873,431.
From September to October 2026, it was $922,643.
That looks like a gain of $49,212.
But consumer prices rose 13.4% in those four years, per the Bureau of Labor Statistics.
So $873,431 then equals $990,362 today.
In real dollars, the average is down $67,719, or 6.8%.
Draper average home price higher or lower than in 2020?
From September to October 2020, the average sold price in Draper was $616,634.
From September to October 2026, it was $922,643.
That looks like a gain of $306,009.
But consumer prices rose 29.5% in those six years, per the Bureau of Labor Statistics.
So $616,634 then equals $798,762 today.
The real gain is $123,881, or 15.5%.
The rest is inflation.
Average Sale Price
The text above uses September to October together. The table shows each month alone.
Month | 2020 | 2021 | 2022 | 2023 | 2024 | 2025 | 2026 |
|---|---|---|---|---|---|---|---|
Jan | $562,943 | $674,938 | $969,467 | $814,903 | $987,236 | $876,301 | $1,046,941 |
Feb | $622,187 | $840,279 | $944,502 | $784,731 | $773,771 | $939,396 | $1,072,969 |
Mar | $604,091 | $718,751 | $987,016 | $795,063 | $856,731 | $1,048,968 | $1,034,721 |
Apr | $552,916 | $764,430 | $869,763 | $891,119 | $873,558 | $1,021,037 | $911,461 |
May | $628,655 | $718,673 | $851,593 | $895,069 | $1,014,571 | $937,835 | $954,133 |
Jun | $521,141 | $778,400 | $934,131 | $842,027 | $914,944 | $916,672 | $817,223 |
Jul | $602,707 | $952,438 | $826,828 | $1,058,278 | $980,406 | $1,028,301 | $931,492 |
Aug | $692,117 | $744,695 | $919,438 | $839,498 | $824,694 | $846,757 | $1,286,165 |
Sep | $647,847 | $752,995 | $852,352 | $836,077 | $935,799 | $1,042,961 | $947,748 |
Oct | $579,890 | $840,868 | $893,852 | $842,882 | $950,411 | $970,101 | $893,488 |
Nov | $662,206 | $768,320 | $920,387 | $1,033,042 | $889,752 | $936,691 | |
Dec | $763,241 | $992,686 | $885,547 | $840,718 | $979,404 | $955,922 |
Why the average is higher than the median: The average is not the typical home. It is $115,643 above the median because 19 MLS sales at or above $1,000,000 from September to October 2026 pull it up.
FHFA’s purchase-only index for the Salt Lake metro rose 0.19% in the year to the second quarter of 2026.
Source: UtahRealEstate.com MLS sold search (Draper, Residential, September to October, 2020–2026) and Sales Per Month Report (Jan 2020–Oct 2026).
What This Means for Sellers
Should I sell my house now or wait?
Waiting cost $1,256 a month. Since September to October 2022, the median sale price rose about 1.3% a year. Consumer prices rose about 3.2% a year, per the Bureau of Labor Statistics. In real dollars, the median home lost $60,302 in four years, about $1,256 a month.
Supply is high. 127 homes were for sale in Draper on November 13, 2026. That is 3.8 months of supply, per UtahRealEstate.com.
Sales are low. 31 homes sold in October 2026, down 13.9% from a year earlier.
Loan rates are high. The 30-year fixed rate was 7.11% on November 12, 2026, up from 6.24% a year earlier, per Freddie Mac.
Concessions help sell for more (and faster). That is based on my experience. In October, 45% of sales included a seller credit. The typical credit was $10,000.
What I'm Seeing & Hearing on the Ground
October notes:
Prep and speed still move together: In October, we saw that homes where sellers took the time to address minor deferred maintenance and dial in presentation went under contract inside two weeks. When a home feels completely move-in ready, serious buyers still step up quickly.
Buyers are hesitating on rates: With 30-year mortgages hovering around 7.11%, many buyers are cautious. They are not leaving the market entirely, but they are recalculating monthly payments carefully and taking breaks when homes feel overpriced.
Prime pockets vs. the rest of the valley: Demand remains steady in well-established east-bench and master-planned pockets—particularly Draper, Sandy, Cottonwood Heights, and South Jordan. Buyers with larger budgets still prioritize strong school boundaries, modern updates, and short commutes, and those homes continue to draw immediate attention.
Condition penalties are real: Outside of turnkey listings, buyers are being very selective. Homes with older mechanicals, roof age concerns, or dated interiors are sitting past 40 days unless the price clearly accounts for the work. At today's borrowing costs, buyers are simply unwilling to finance a remodel on top of their monthly payment.

Draper real estate MLS statistics for October 2026
What changed in the Draper UT housing market in October 2026?
In October 2026, Draper home prices fell, with a median sold price of $669,840, down 20.0% from a year earlier. Closed sales fell 13.9% to 31, and the average home took 84 days to go under contract, up from 71 days in October 2025.
Draper | Oct 2026 | Sep 2026 | Oct 2025 | Month % | Year % |
|---|---|---|---|---|---|
Closed sales | 31 | 36 | 36 | −13.9% | −13.9% |
Median sold price | $669,840 | $885,000 | $837,500 | −24.3% | −20.0% |
Average sold price | $893,488 | $947,748 | $970,101 | −5.7% | −7.9% |
Sale to list price ratio | 91.0% | 93.0% | 92.0% | −2.0 pts | −1.0 pts |
Average days on market | 84 | 76 | 71 | +8 days | +13 days |
Median price per sq ft (MLS) | $251.34 | $236.68 | $262.80 | +6.2% | −4.4% |
Source: UtahRealEstate.com MLS Sales Per Month Report (Draper, Residential, Oct 2025–Oct 2026).
Inventory
How many homes are currently for sale in Draper?
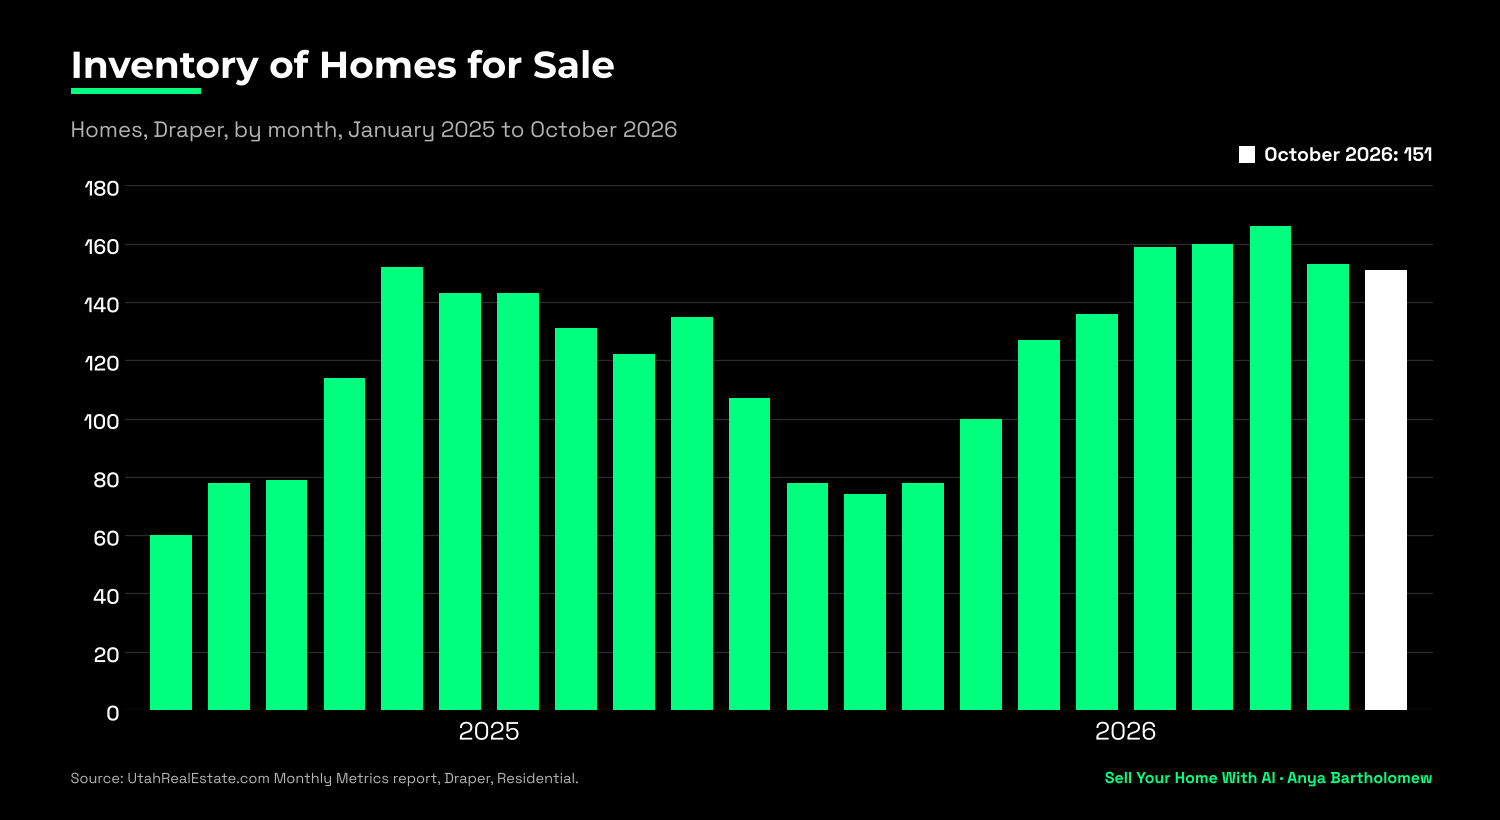
In October 2026, Draper had 151 homes for sale, up 11.9% from 135 in October 2025, per the UtahRealEstate.com Monthly Metrics report. Sellers added 43 new listings during the month, down 29.5% from 61 a year earlier, and 35 homes went under contract, up 12.9% from 31.
Months of Inventory
How long would it take to sell every listed home?
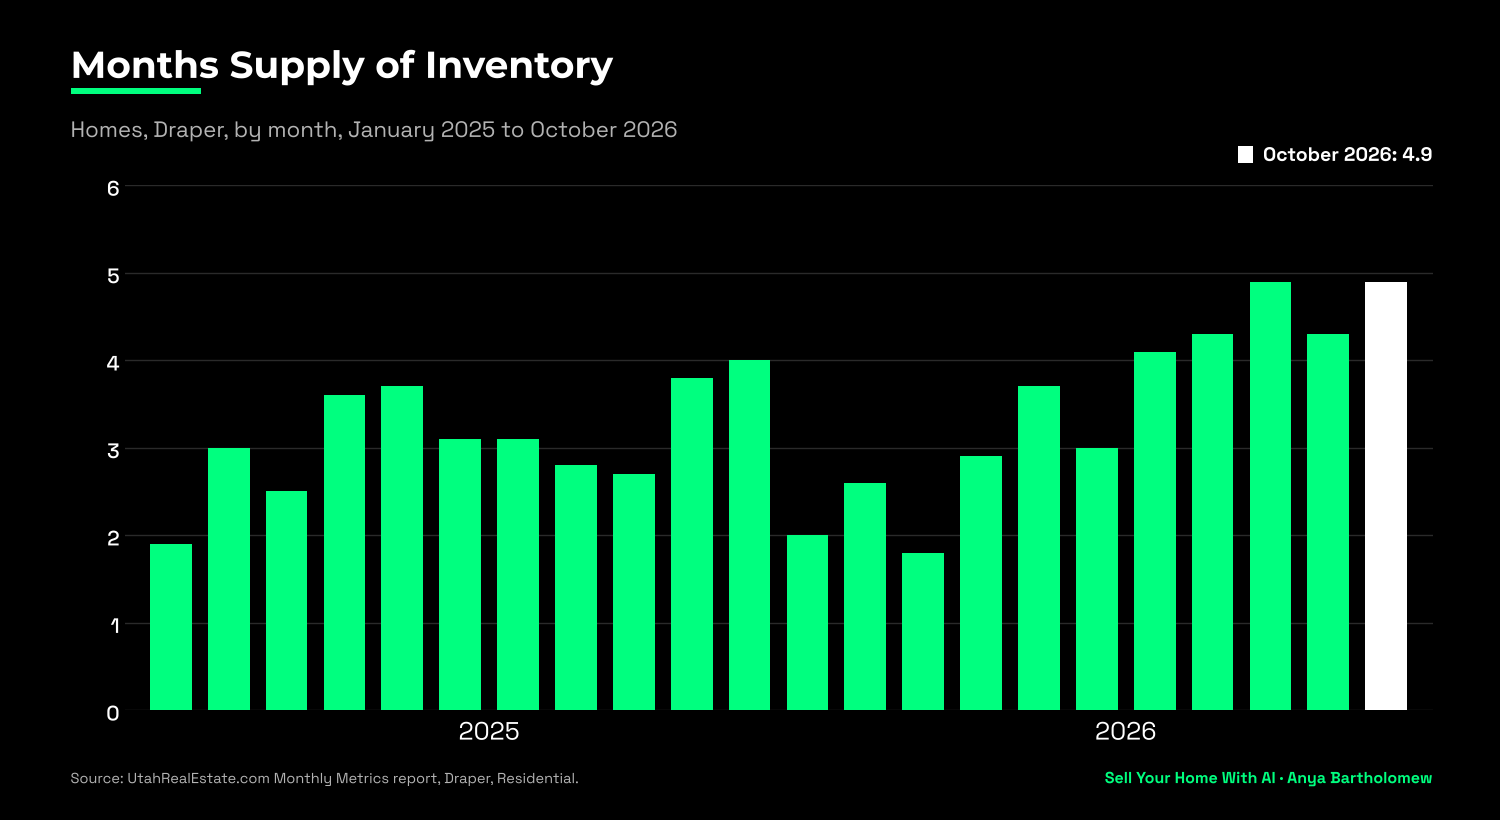
Draper held 4.9 months of inventory in October 2026, up from 3.8 months in October 2025, per the UtahRealEstate.com Monthly Metrics report. That is 151 homes for sale at the end of October divided by 31 closed sales in October. Nationally, NAR reported 5.1 months in October 2026.
Source: UtahRealEstate.com Monthly Metrics report (Draper, Residential, Jan 2025–Oct 2026).
Average Days on Market
How fast are Draper homes going under contract?
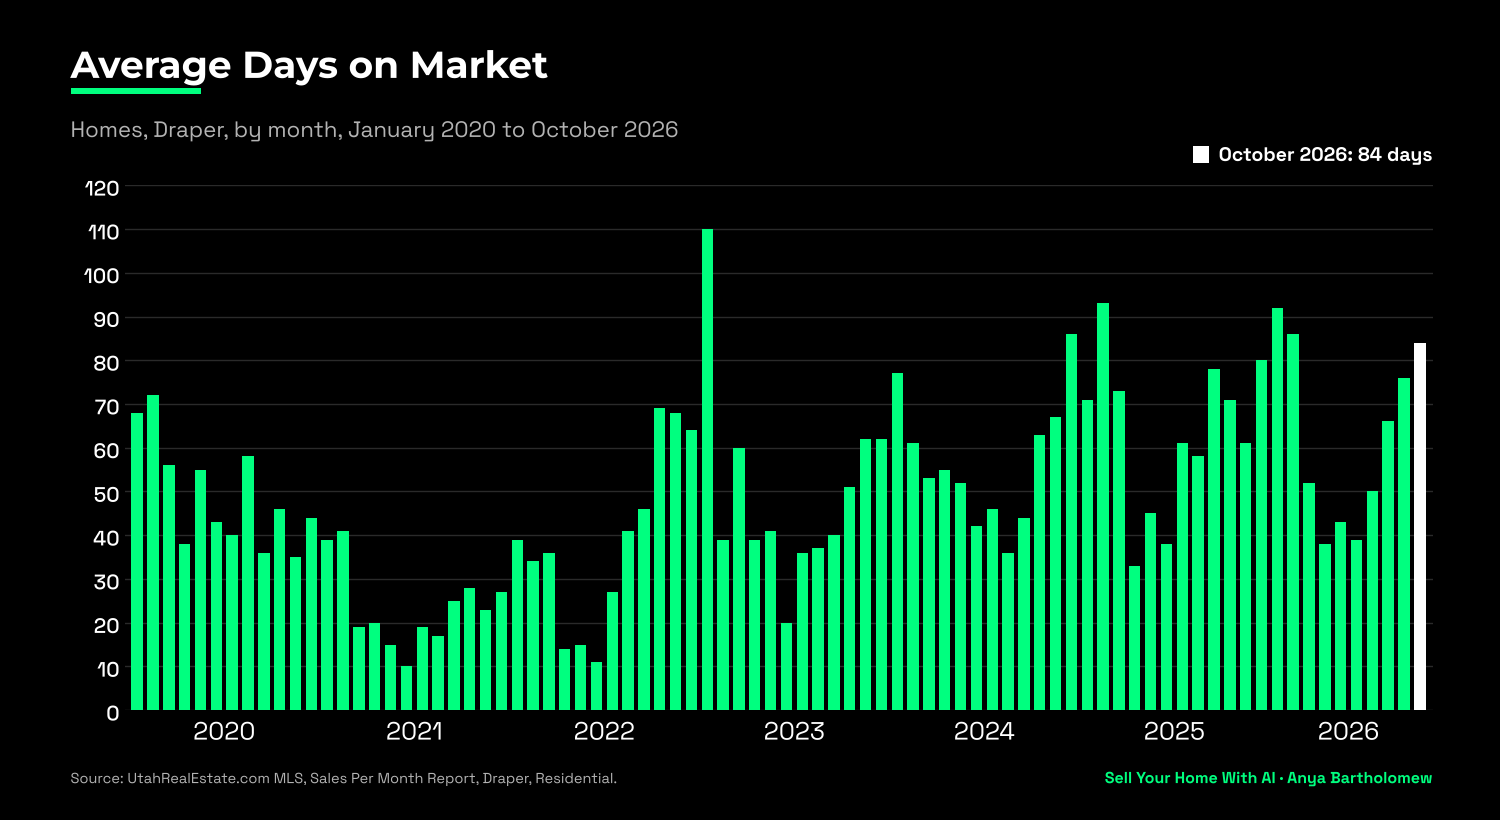
The average home that closed in October 2026 went under contract in 84 days, compared to 10 days at the June 2021 peak. In the October MLS sold export, 7 homes went under contract in under 30 days and sold at a median 99.2% of asking price. The 17 homes that took 60 days or more sold at a median 89.7%.
Average Days on Market
Month | 2020 | 2021 | 2022 | 2023 | 2024 | 2025 | 2026 |
|---|---|---|---|---|---|---|---|
Jan | 68 | 39 | 39 | 110 | 77 | 71 | 92 |
Feb | 72 | 41 | 34 | 39 | 61 | 93 | 86 |
Mar | 56 | 19 | 36 | 60 | 53 | 73 | 52 |
Apr | 38 | 20 | 14 | 39 | 55 | 33 | 38 |
May | 55 | 15 | 15 | 41 | 52 | 45 | 43 |
Jun | 43 | 10 | 11 | 20 | 42 | 38 | 39 |
Jul | 40 | 19 | 27 | 36 | 46 | 61 | 50 |
Aug | 58 | 17 | 41 | 37 | 36 | 58 | 66 |
Sep | 36 | 25 | 46 | 40 | 44 | 78 | 76 |
Oct | 46 | 28 | 69 | 51 | 63 | 71 | 84 |
Nov | 35 | 23 | 68 | 62 | 67 | 61 | |
Dec | 44 | 27 | 64 | 62 | 86 | 80 |
Source: UtahRealEstate.com MLS Sales Per Month Report and October 2026 sold export (Draper, Residential, Jan 2020–Oct 2026).
Sale to List Price Ratio
Are homes in Draper selling below asking price?
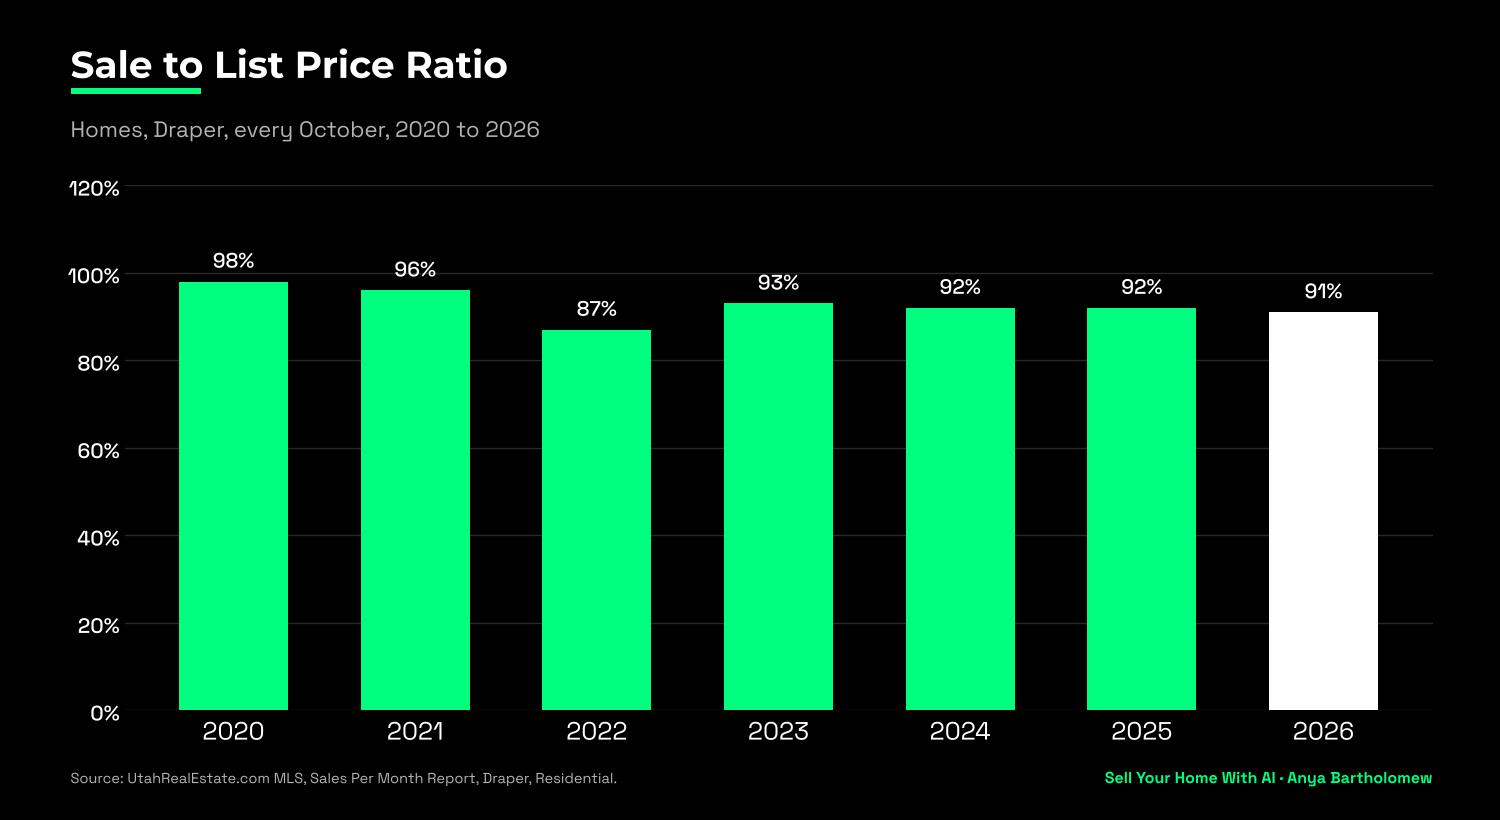
Yes. In October 2026, sellers received 91% of the original list price, per the UtahRealEstate.com MLS Sales Per Month Report. Home by home, the median sale closed at 94.8% of its first asking price, per the UtahRealEstate.com MLS. 80.6% of October closings sold below initial asking, and 45% included a recorded seller concession (median: $10,000).
Sale to List Price Ratio
Month | 2020 | 2021 | 2022 | 2023 | 2024 | 2025 | 2026 |
|---|---|---|---|---|---|---|---|
Jan | 94.0% | 97.0% | 98.0% | 88.0% | 92.0% | 92.0% | 92.0% |
Feb | 97.0% | 100.0% | 100.0% | 95.0% | 95.0% | 94.0% | 92.0% |
Mar | 95.0% | 103.0% | 103.0% | 93.0% | 96.0% | 96.0% | 98.0% |
Apr | 97.0% | 103.0% | 102.0% | 96.0% | 97.0% | 98.0% | 98.0% |
May | 97.0% | 101.0% | 101.0% | 93.0% | 98.0% | 96.0% | 98.0% |
Jun | 97.0% | 102.0% | 100.0% | 98.0% | 96.0% | 97.0% | 95.0% |
Jul | 97.0% | 96.0% | 94.0% | 98.0% | 96.0% | 90.0% | 96.0% |
Aug | 97.0% | 96.0% | 91.0% | 95.0% | 95.0% | 95.0% | 93.0% |
Sep | 98.0% | 97.0% | 93.0% | 96.0% | 93.0% | 90.0% | 93.0% |
Oct | 98.0% | 96.0% | 87.0% | 93.0% | 92.0% | 92.0% | 91.0% |
Nov | 98.0% | 99.0% | 88.0% | 89.0% | 92.0% | 92.0% | |
Dec | 98.0% | 100.0% | 91.0% | 90.0% | 85.0% | 92.0% |
Source: UtahRealEstate.com MLS Sales Per Month Report and October 2026 sold export (Draper, Residential, Jan 2020–Oct 2026).
Median Price per Square Foot
What does a square foot sell for in Draper?
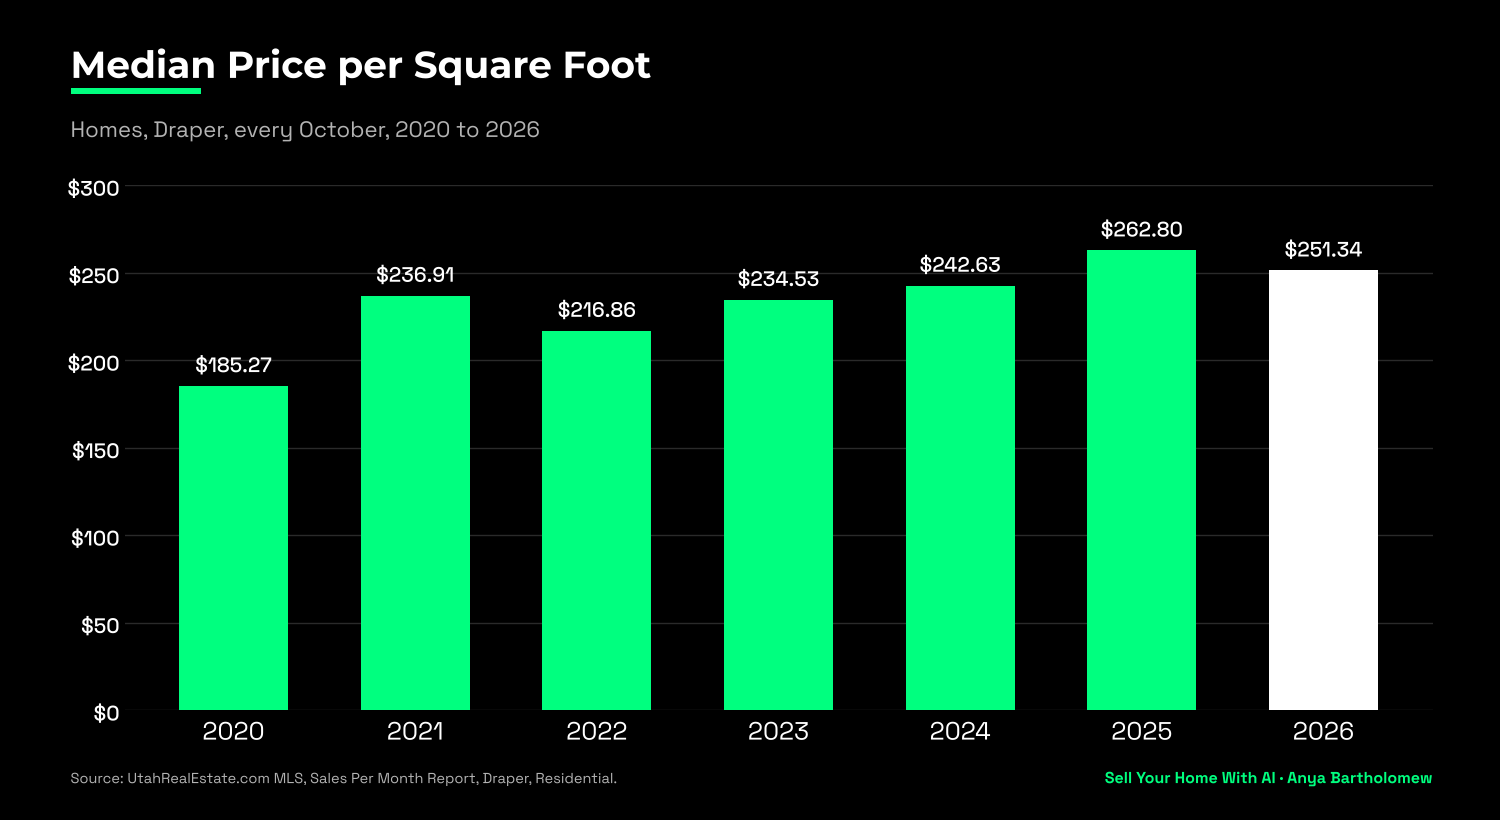
The median price per square foot for homes in Draper was $251.34 in October 2026, down 4.4% from $262.80 in October 2025. That is still 35.7% above October 2020, six years ago, when a square foot sold for $185.27.
Median Price per Square Foot
Month | 2020 | 2021 | 2022 | 2023 | 2024 | 2025 | 2026 |
|---|---|---|---|---|---|---|---|
Jan | $163.91 | $176.86 | $245.26 | $232.65 | $231.03 | $284.41 | $267.35 |
Feb | $148.46 | $188.94 | $228.22 | $241.43 | $232.17 | $256.88 | $251.04 |
Mar | $159.38 | $200.22 | $257.24 | $232.39 | $241.37 | $249.59 | $257.59 |
Apr | $173.02 | $208.04 | $268.26 | $248.07 | $255.35 | $264.41 | $273.71 |
May | $171.00 | $217.54 | $268.57 | $244.65 | $252.84 | $265.47 | $270.01 |
Jun | $167.97 | $222.65 | $267.58 | $250.91 | $233.60 | $251.96 | $260.89 |
Jul | $172.11 | $221.05 | $235.31 | $252.34 | $252.93 | $240.10 | $273.74 |
Aug | $167.97 | $233.44 | $241.61 | $221.24 | $261.80 | $259.27 | $258.20 |
Sep | $169.71 | $242.51 | $237.58 | $230.04 | $263.38 | $256.57 | $236.68 |
Oct | $185.27 | $236.91 | $216.86 | $234.53 | $242.63 | $262.80 | $251.34 |
Nov | $179.86 | $221.82 | $238.13 | $254.19 | $243.52 | $263.73 | |
Dec | $181.02 | $235.26 | $252.67 | $227.61 | $245.41 | $241.74 |
Source: UtahRealEstate.com MLS Sales Per Month Report (Draper, Residential, Jan 2020–Oct 2026).
Number of Sales
How many homes are selling in Draper?
31 homes closed in Draper in October 2026, down 13.9% from 36 in October 2025. It is the lowest October total from 2020 to 2026, and 30.1% below the monthly average of 44 sales from January 2020 to December 2025.
October 2020 = 79
October 2021 = 50
October 2022 = 32
October 2023 = 36
October 2024 = 48
October 2025 = 36
October 2026 = 31
Recently sold homes Draper Utah, by neighborhood, are in the next section.
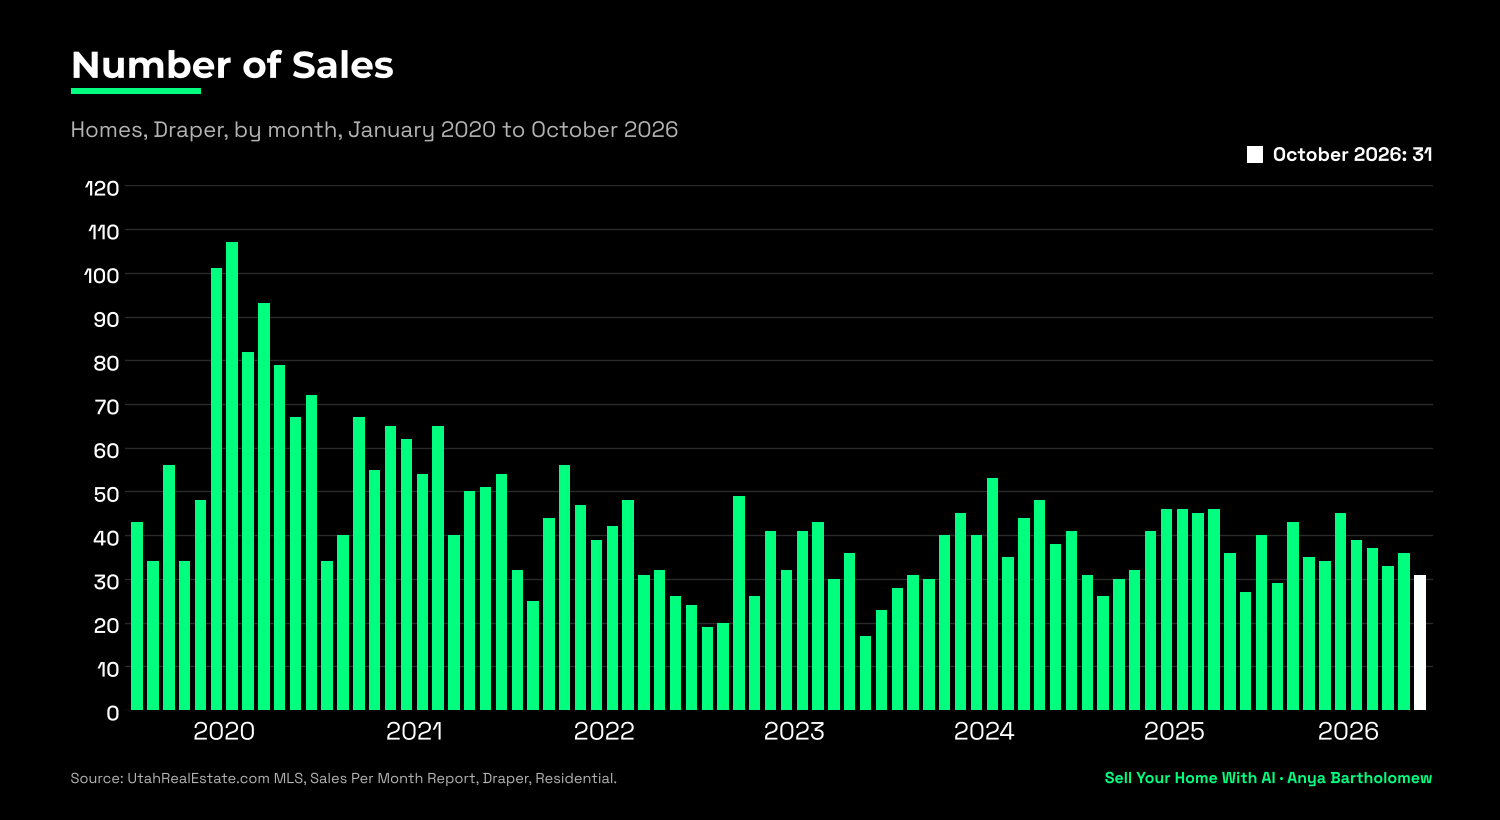
Number of Sales
Month | 2020 | 2021 | 2022 | 2023 | 2024 | 2025 | 2026 |
|---|---|---|---|---|---|---|---|
Jan | 43 | 34 | 32 | 19 | 28 | 31 | 29 |
Feb | 34 | 40 | 25 | 20 | 31 | 26 | 43 |
Mar | 56 | 67 | 44 | 49 | 30 | 30 | 35 |
Apr | 34 | 55 | 56 | 26 | 40 | 32 | 34 |
May | 48 | 65 | 47 | 41 | 45 | 41 | 45 |
Jun | 101 | 62 | 39 | 32 | 40 | 46 | 39 |
Jul | 107 | 54 | 42 | 41 | 53 | 46 | 37 |
Aug | 82 | 65 | 48 | 43 | 35 | 45 | 33 |
Sep | 93 | 40 | 31 | 30 | 44 | 46 | 36 |
Oct | 79 | 50 | 32 | 36 | 48 | 36 | 31 |
Nov | 67 | 51 | 26 | 17 | 38 | 27 | |
Dec | 72 | 54 | 24 | 23 | 41 | 40 |
Source: UtahRealEstate.com MLS Sales Per Month Report (Draper, Residential, Jan 2020–Oct 2026).
Draper Home Values by Neighborhood
Which Draper neighborhoods sold, and at what price?
Draper homes sold from September to October 2026: 67, per the UtahRealEstate.com MLS. The table groups recently sold homes in Draper Utah by MLS subdivision name. South Mountain had the most sales, 6, at a median of $952,500. Small counts swing widely, so a price comes from the closest five or six sales.
Sold homes Draper Utah by neighborhood
Neighborhood | Sales | Median sold price | Median days on market |
|---|---|---|---|
South Mountain Draper Utah (includes Sunset Ridge and Montreaux) | 6 | $952,500 | 119 |
SunCrest Draper (Salt Lake side, includes Oak Vista and Stoneleigh Heights) | 4 | $547,500 | 53 |
Centennial Heights | 3 | $825,000 | 26 |
Draper Creekside Townhomes | 3 | $504,500 | 63 |
Bellevue Draper Utah | 2 | $1,124,888 | 49 |
Corner Canyon Draper Utah | 1 | one sale | one sale |
Draper Peaks Condos | 1 | one sale | one sale |
Sunset Ridge Draper Utah: 3 of the 6 South Mountain sales. No home closed in Hidden Canyon Estates Draper Utah or Sterling Heights Draper.
Source: UtahRealEstate.com MLS sold search (Draper, Residential, Sep–Oct 2026).
Expired and Cancelled Listings
How many Draper listings failed to sell in October?
In October 2026, 20 listings expired or were cancelled across Draper, the second-highest October count since 2020, down from 23 in October 2025. That is 8 expired and 12 cancelled. For every 100 homes that sold in October, 65 listings failed.
Expired and cancelled listings, Draper:
October 2020 = 11
October 2021 = 6
October 2022 = 18
October 2023 = 11
October 2024 = 17
October 2025 = 23
October 2026 = 20
Withdrawn listings, October 2026 = 4
Expired = the agreement ran out. Cancelled = seller and agent ended it early by agreement. Withdrawn = the agreement is still in effect, but the home was pulled from MLS marketing.
Source: UtahRealEstate.com MLS expired, canceled and withdrawn listing search (Draper, Residential, Octobers 2020–2026).
Foreclosures
How many Utah homes are in foreclosure?
Utah foreclosure filings, per ATTOM:
August 2026: 419 filings, one per 2,920 housing units.
Rank: ninth-highest rate among the states.
U.S. rate in August: one per 3,569 housing units.
First half of 2026: 0.19% of Utah housing units, against 0.16% nationwide.
The figures cover all of Utah, not only Draper.
Source: ATTOM U.S. Foreclosure Market Report (Utah, all housing units, August 2026 and January–June 2026).
FAQ on Draper Home Values
My home was listed but did not sell. What should I check?
Evaluate your listing against three October 2026 MLS benchmarks:
Review October days on market. Half of the homes that sold went under contract in 76 days or less. Homes under contract in under 30 days sold at 99.2% of the first asking price. Homes that took 60 days or more sold at 89.7%. On a $600,000 home, that gap is $57,000.
Research October concession credits. High loan rates make buyers ask for help. 45% of October sales had a seller credit. The typical credit was $10,000. The MLS sold price does not show it, so count it yourself.
Compete with a credit, not only with price. About four homes were for sale for each one that sold in October. Buyers shop by monthly payment. At 7.11%, the payment on a $600,000 home with 20% down is $3,229. Offer a credit that lowers the payment, and ask a lender to show you the math.
How much are sellers giving in concessions in Draper?
When mortgage rates are high, buyers ask for more concessions. In October 2026, 45% of sales in Draper included a recorded seller concession, with a median of $10,000, per the UtahRealEstate.com MLS October 2026 sold export. MLS sold prices are recorded before concessions, so the seller's net is the sold price minus the concession.
Is Draper a buyer's or seller's market right now?
With mortgage rates at 7.11%, these numbers are no surprise. The October 2026 numbers for Draper homes: 80.6% sold below their original asking price, the average home took 84 days to go under contract, and 20 listings expired or were cancelled. In October 2026, Draper held 4.9 months of inventory.
Why are prices dropping faster than sales?
In October 2026, closings in Draper fell 13.9% from a year earlier, while the median sold price moved 20.0%. Over the same year, the 30-year fixed rate rose from 6.24% to 7.11% (Freddie Mac), and the home a buyer can afford on the same payment fell by $51,410 on a $600,000 home with 20% down.
Are Draper home prices falling in real dollars?
Yes. From September to October 2026, the Draper median sold price was $807,000, on 67 sales, per the UtahRealEstate.com MLS. From September to October 2022 it was $764,900, on 63 sales. Adjusted for inflation with the Bureau of Labor Statistics Consumer Price Index, $764,900 then equals $867,302 today. So in real dollars the median is down $60,302, or 7.0%, even though the price as paid rose $42,100.
How do you adjust a home price for inflation?
Multiply the old price by today's Consumer Price Index and divide by the index in the old period. The Bureau of Labor Statistics index for all urban consumers averaged 297.410 from September to October 2022 and 337.226 from September to October 2026. So $764,900 × 337.226 ÷ 297.410 = $867,302 in September to October 2026 dollars.